Multiple Jobholders Account for 5.3% of All Employed

Will American Economy
Crash?


American Economy Crash?
America only has money till June 1 to pay its bills? Will all the money will be gone after that & Why Joe Biden is worried about it, So much that, he cancelled the Quad meeting. He went to America to personally solve this crisis.
What is happening in America?
What difference does it make to the whole world?
Let’s decode this in this blog….!
Part One:
America's money is over. India's economy is about $3 trillion and that of America is $23 trillion. Economically, America is 8X bigger than India. But even this much money falls short for them. Why?
Because of a simple mistake Americans do, SAVINGS = (INCOME – EXPENSES).
If you earn in millions and spend in billions, then how on earth are you going to save?
The economy of a country seems complex but does run on this simple logic.
Let’s understand how?
The US runs on a budgetary deficit. That is, their government spends more money than it earns through taxes or other means.
Where does this extra money come from?
They also have to take loans and have to borrow money.
Why does the government do this? Are we donkeys?
No, the government is not stupid. But to control the economy, you have to balance it.
Govt. faces a major challenge between the Country’s economic growth and balancing inflation. If you want to focus on growth, inflation will increase. Things will be expensive. If you want to control inflation, you have to put a speed breaker on growth.
Now, let's understand some terms first.
The US's Finance Ministry is called the Treasury Department. Its parliament is called Congress and the upper house is called Senate. All the laws are collectively made by the Congress. The White House is the president’s office. The Central Bank of the US is called the Federal Reserve.
Now let's come to the point. The expenses of the USA are much higher than their tax revenues. The US pays this difference with loans. The government's expenses are decided by some laws that Congress has already passed. Like military spending, medical aid, Social Security benefits, Education, Transportation, etc. Similarly, they have created a system for debt. It's called the debt ceiling. It says that well, you need money to run the economy, so you can borrow money to this limit. If you hit that limit and you want to cross it, then you have to take permission. This debt ceiling has increased 78 times since 1960. The most debt was taken in the presidency of Obama. That's a $7.6 trillion debt. After that comes, Donald Trump,
who borrowed $6.7 trillion. Biden, in just one year of presidency,
has increased the debt by $2.5 trillion. In January 2023,
The USA had hit its debt ceiling. The debt then was $31 trillion.
https://www.linkedin.com/pulse/american-economy-crash-swapnil-kadam
What are the long-term trends for multiple jobholders in the US? The Bureau of Labor Statistics has three decades of historical data to enlighten us on that topic, courtesy of table A-16 in the monthly Current Population Survey of households.
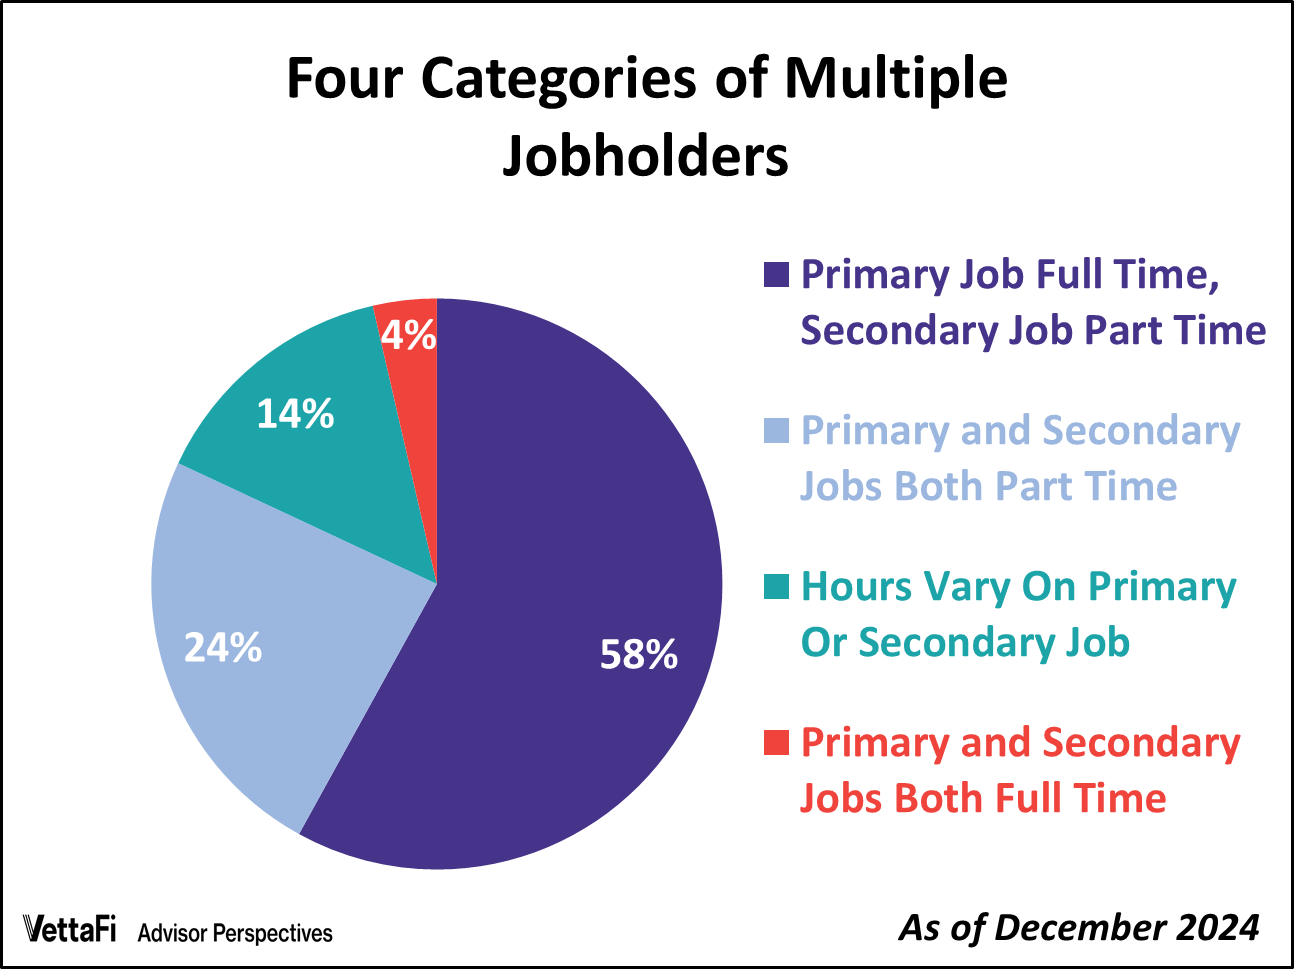 In December, there were 8.607 million people working multiple jobs in the U.S. Multiple jobholders now account for 5.3% of civilian employment. The survey captures data for four subcategories (in pie chart at right) of the multi-job workforce, the relative sizes of which are illustrated in a pie chart. The distinction between "primary" and "secondary" jobs is a subjective one determined by the survey participants.
Not included in the statistics are the approximately 0.03% of the employed who work part-time on what they consider their primary job and full time on their secondary job(s).
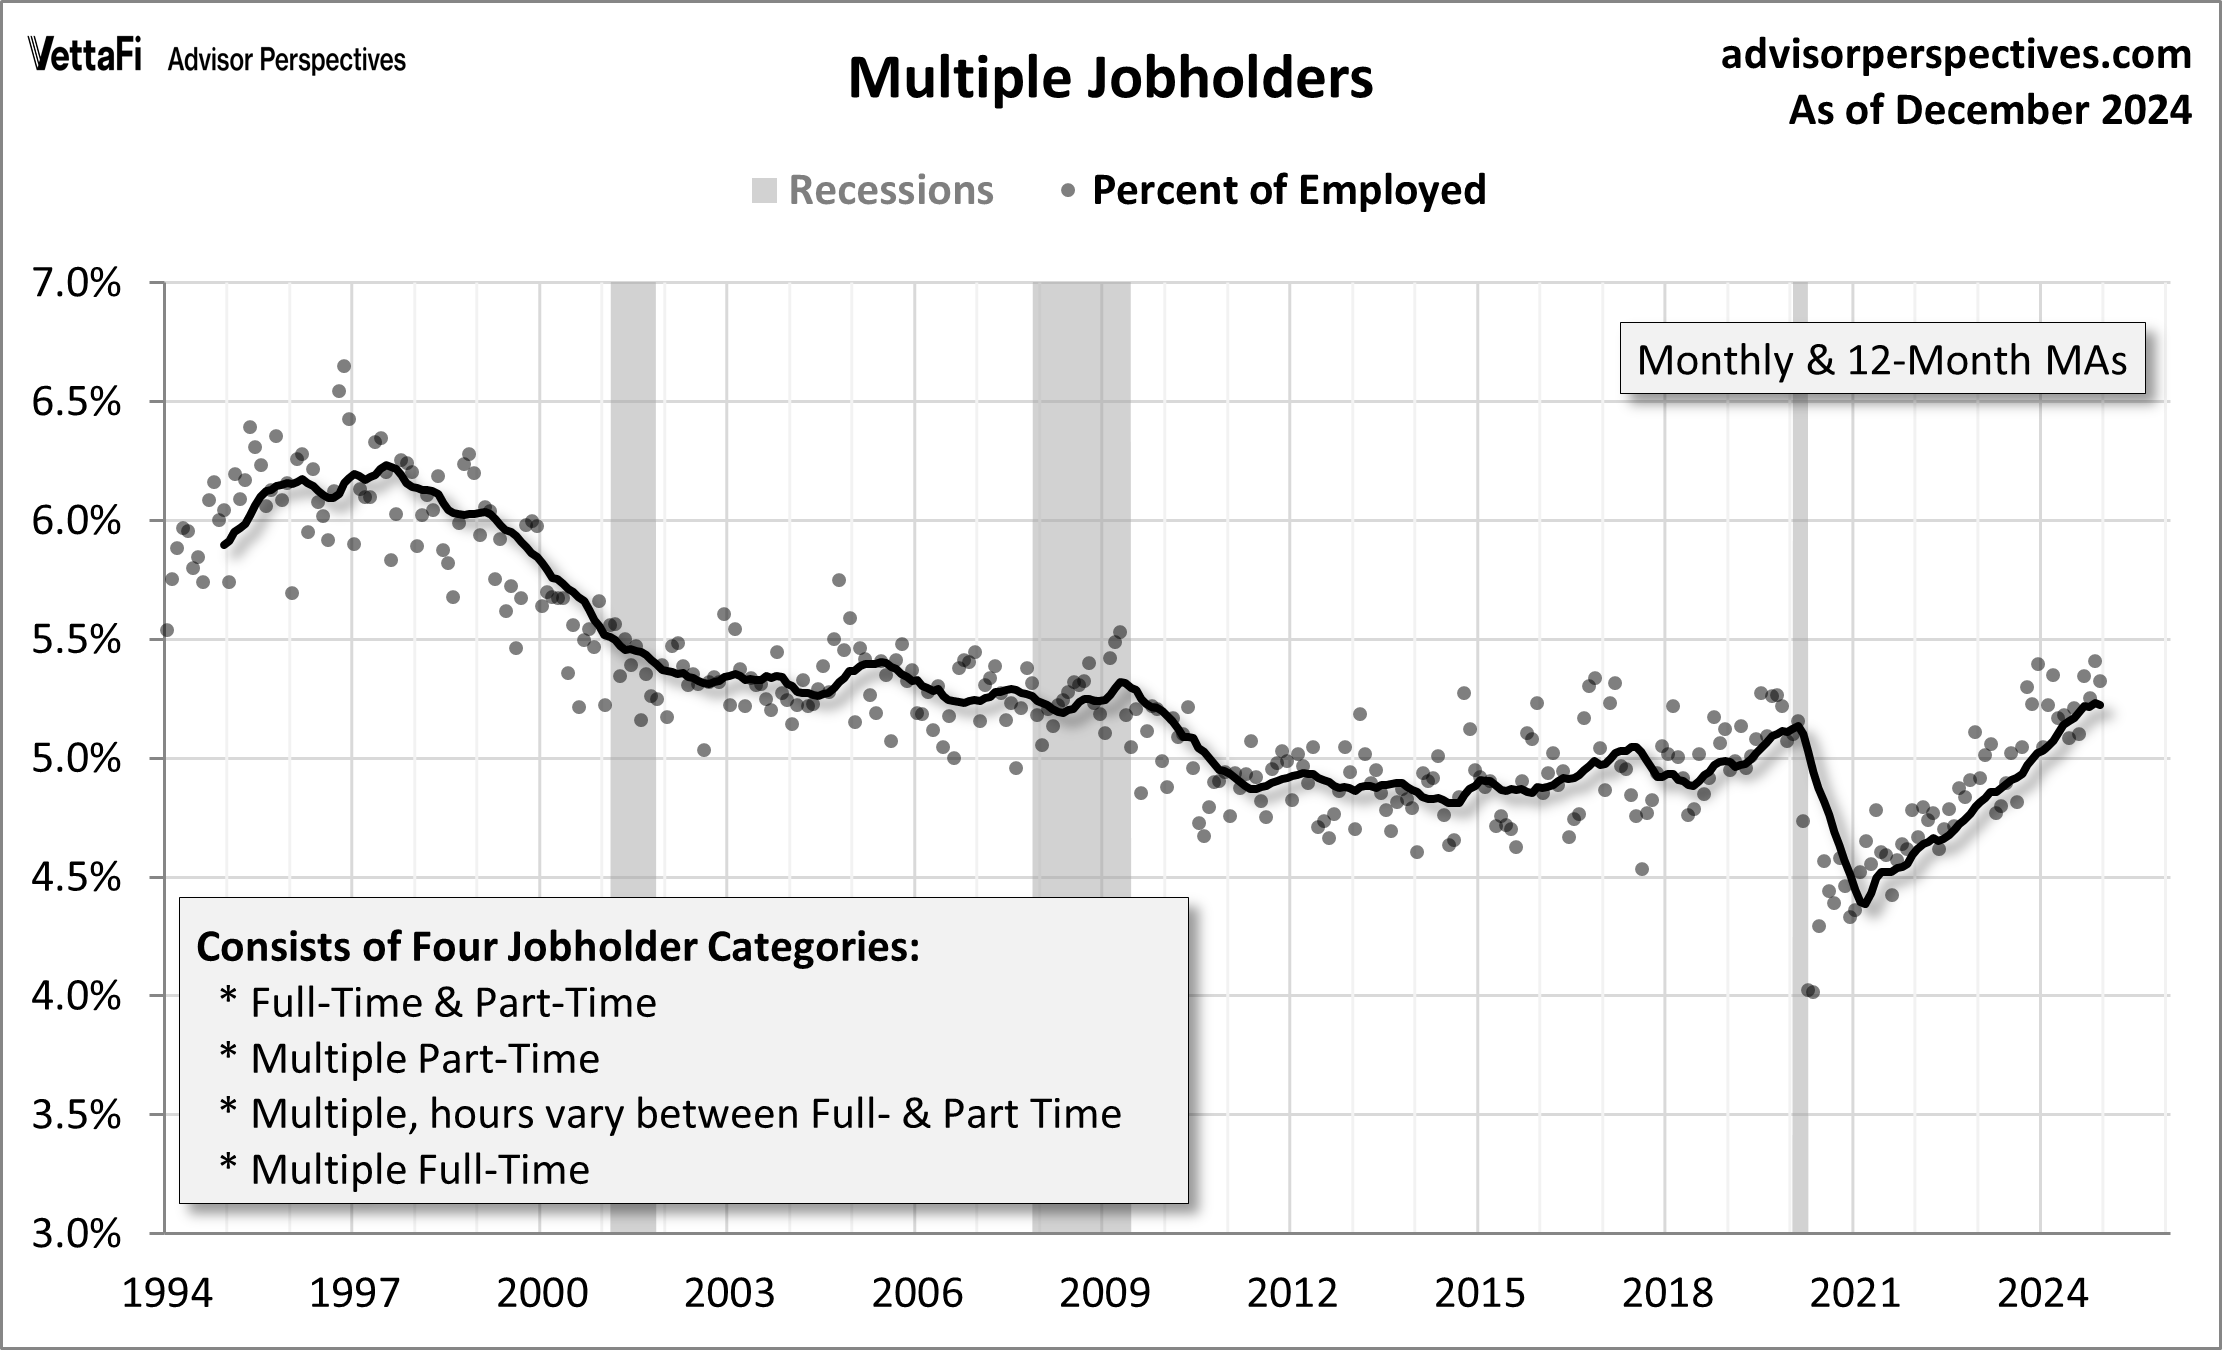
Let's review the complete series to help us get a sense of the long-term trends. Here is a look at all the multiple jobholders as a percent of the civilian employed. The dots are the non-seasonally adjusted monthly data points. Multiple jobholders have accounted for 5.0% or more of total employed persons for 16 straight months, the longest streak since the runup to the 2020 pandemic (17 months).
However, the monthly data points can be quite volatile so we've added a 12-month moving average to highlight the trend. The moving average peaked in the summer of 1997 and then began trending downward. The moving average hovered slightly below 5% between the last two recessions before dropping to as low as 4.4% in 2021. Since then, it has been trending upwards and is now above pre-pandemic levels. The moving average currently sits at 5.22%.
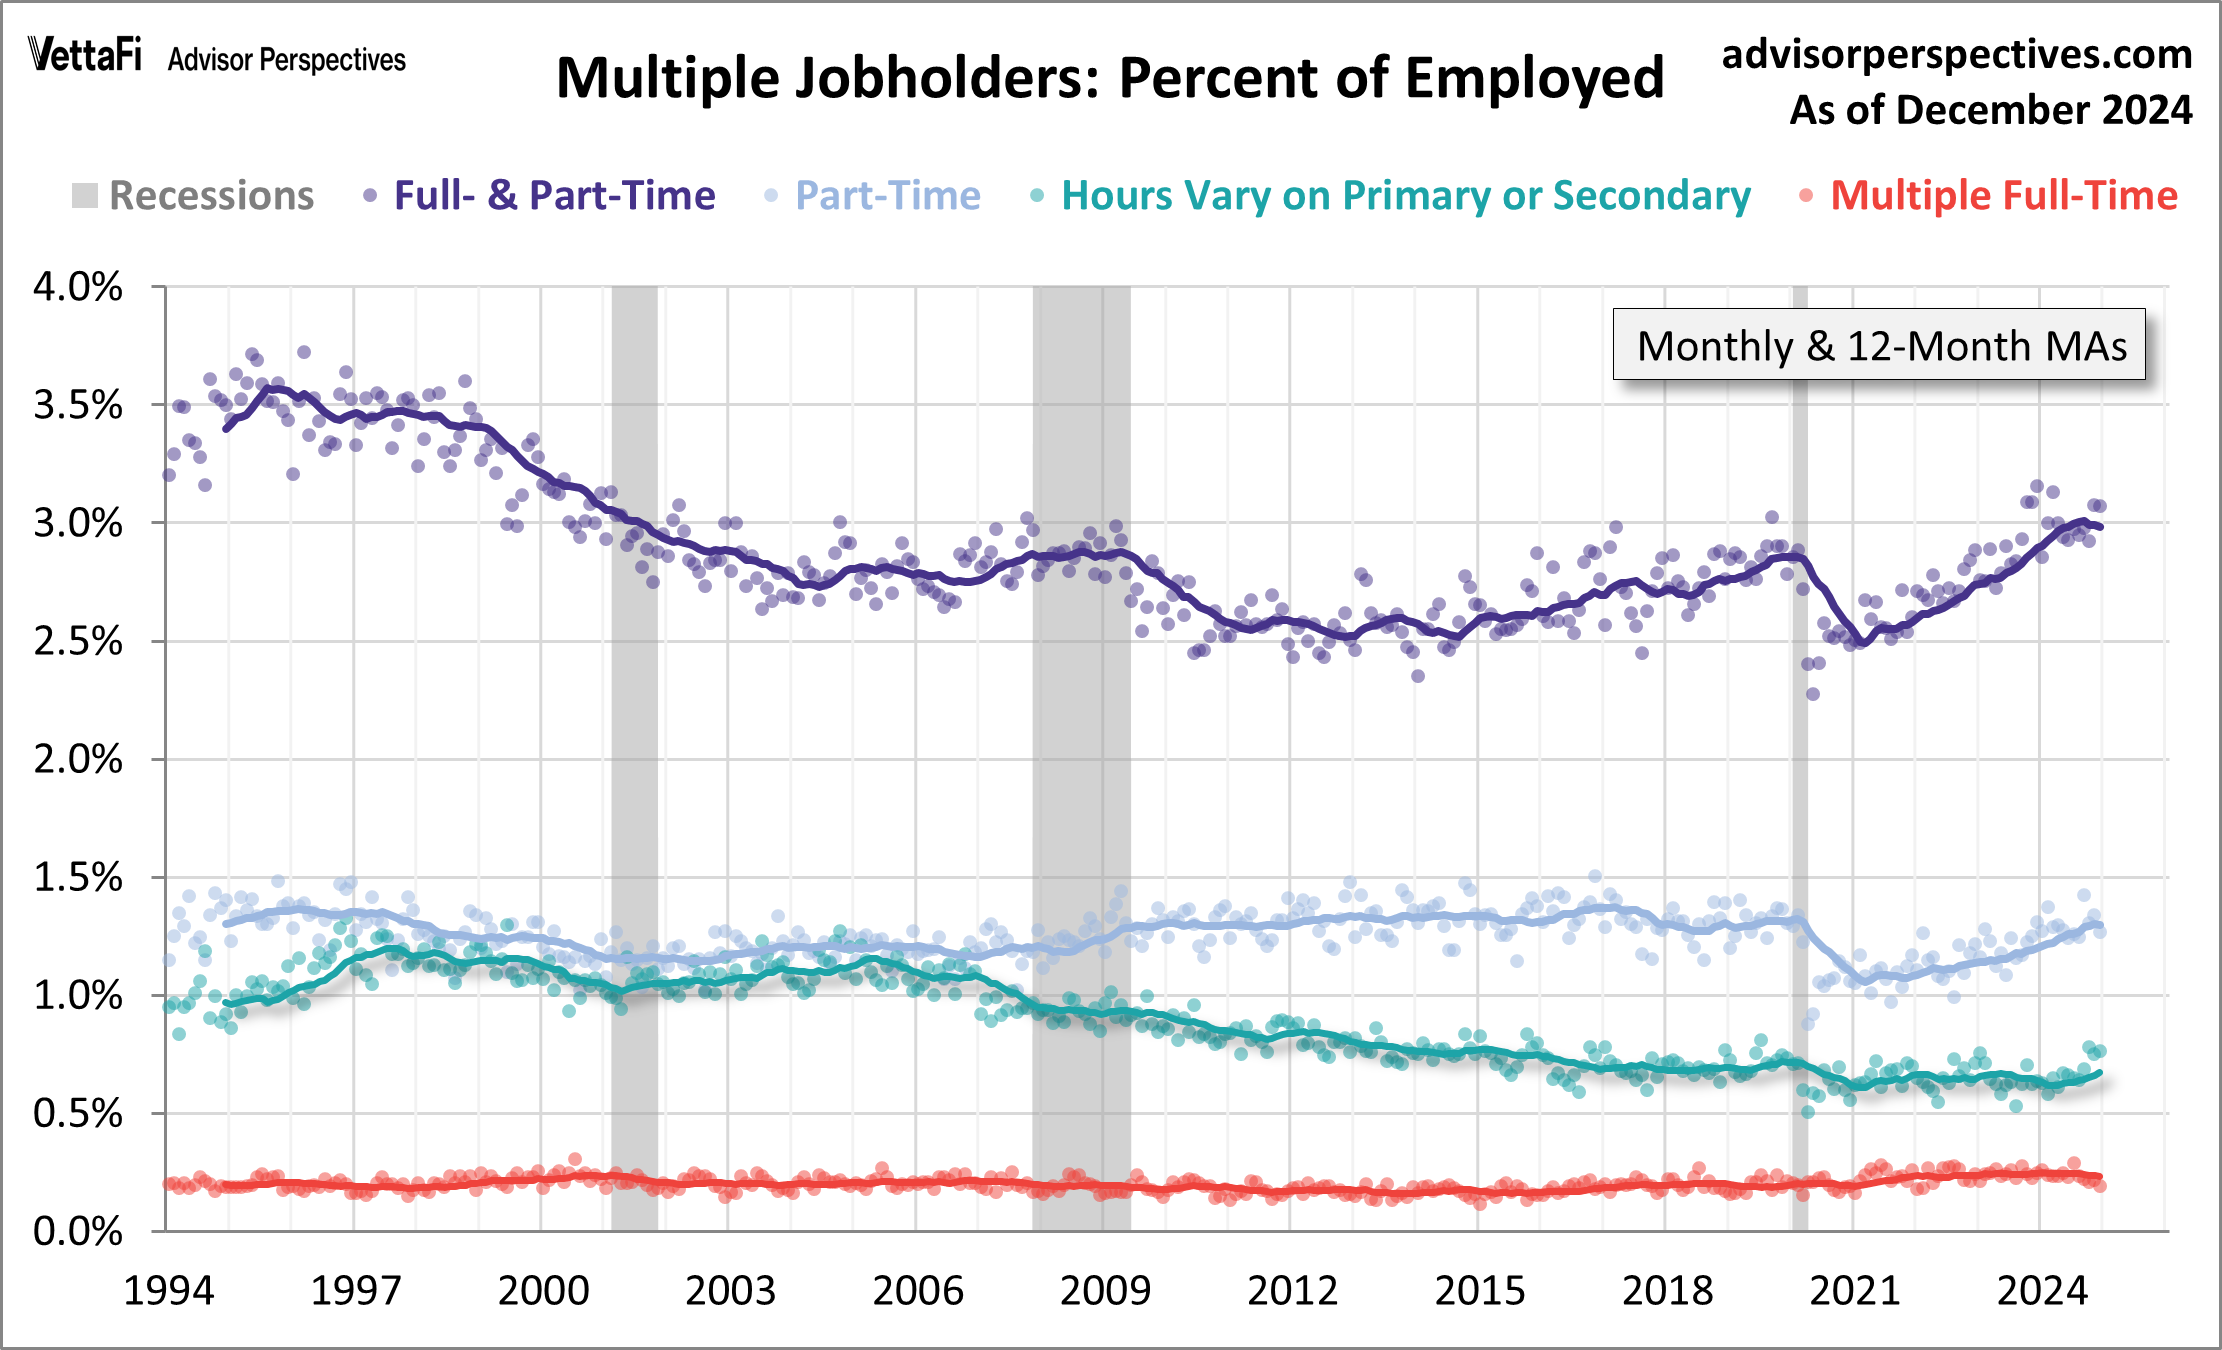
The next chart focuses on all four subcategories referenced in the pie chart. The trend outlier is the series illustrated with the blue line: multiple part-time jobholders. Its trough was in 2002 and trended higher in early 2007, long before Obamacare. At about the same time we also see a steepening decline in the trend for the employed whose hours vary between full- and part-time for either their primary or secondary job. Immediately following the COVID-pandemic, we saw a sharp decline in those who work full and part time as well as those who work multiple part-time jobs. But starting in 2021, both groups have been steadily increasing, albeit not at the same rate. As you can see in the chart below, those working full and part time now sits at its highest level since the turn of the century. Meanwhile, those working multiple full-time jobs has remained steady over time.
This next chart gives a closer look at the two cohorts that have changed the most since the mid-2000s. I've rescaled the vertical axis to give us a clearer view of the trends.
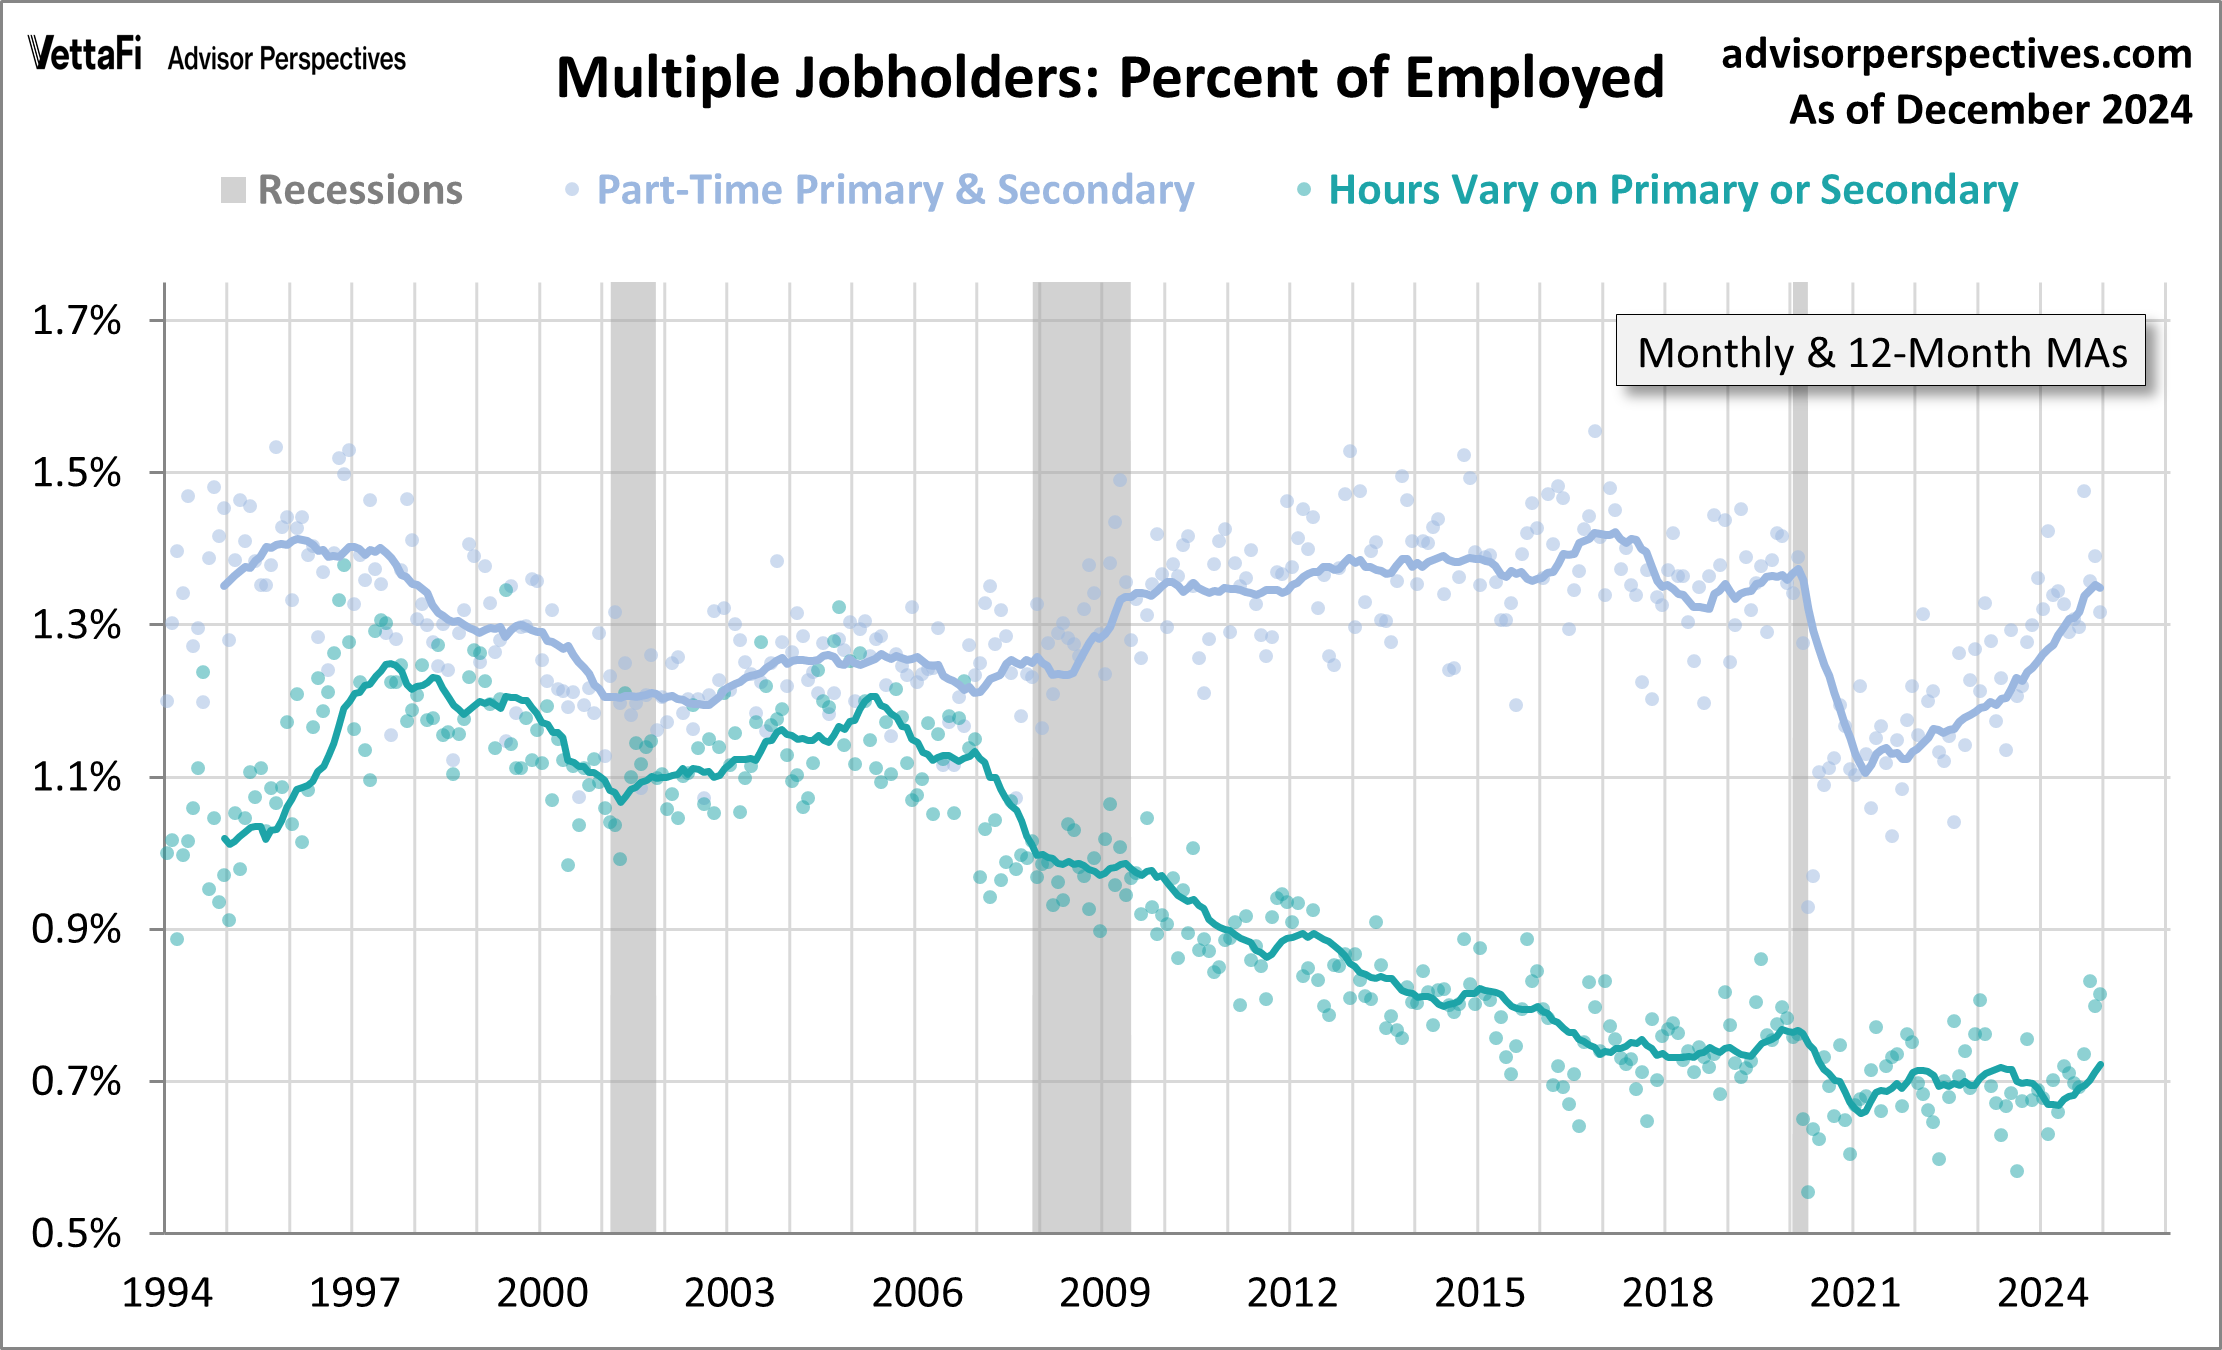
The Great Recession noticeably increased the percentage of multiple part-time jobholders. This metric leveled out in 2010 and 2011, but it subsequently resumed a slow upward trend up until the COVID-pandemic. It seems likely that the downward trend for the cohort whose hours vary for their primary or secondary job (the green line) has contributed to the rise of exclusively part-timers (the blue line).
For a more detailed look at the broader topic of the full-time/part-time ratio see this monthly update.
Here's our list of monthly employment updates:
Job Openings and Labor Turnover Summary (JOLTS)
https://www.advisorperspectives.com/dshort/updates/2025/01/13/multiple-jobholders-account-for-5-3-of-all-employed#:~:text=In%20November%2C%20there%20were%208.716,illustrated%20in%20a%20pie%20chart.


Comentários
Postar um comentário